

Overview
Your daily glance — revenue, orders, site health, and whether anything is wrong right now.
The Overview answers one question: is my store fine? It is scoped to a single site, chosen in the sidebar switcher.
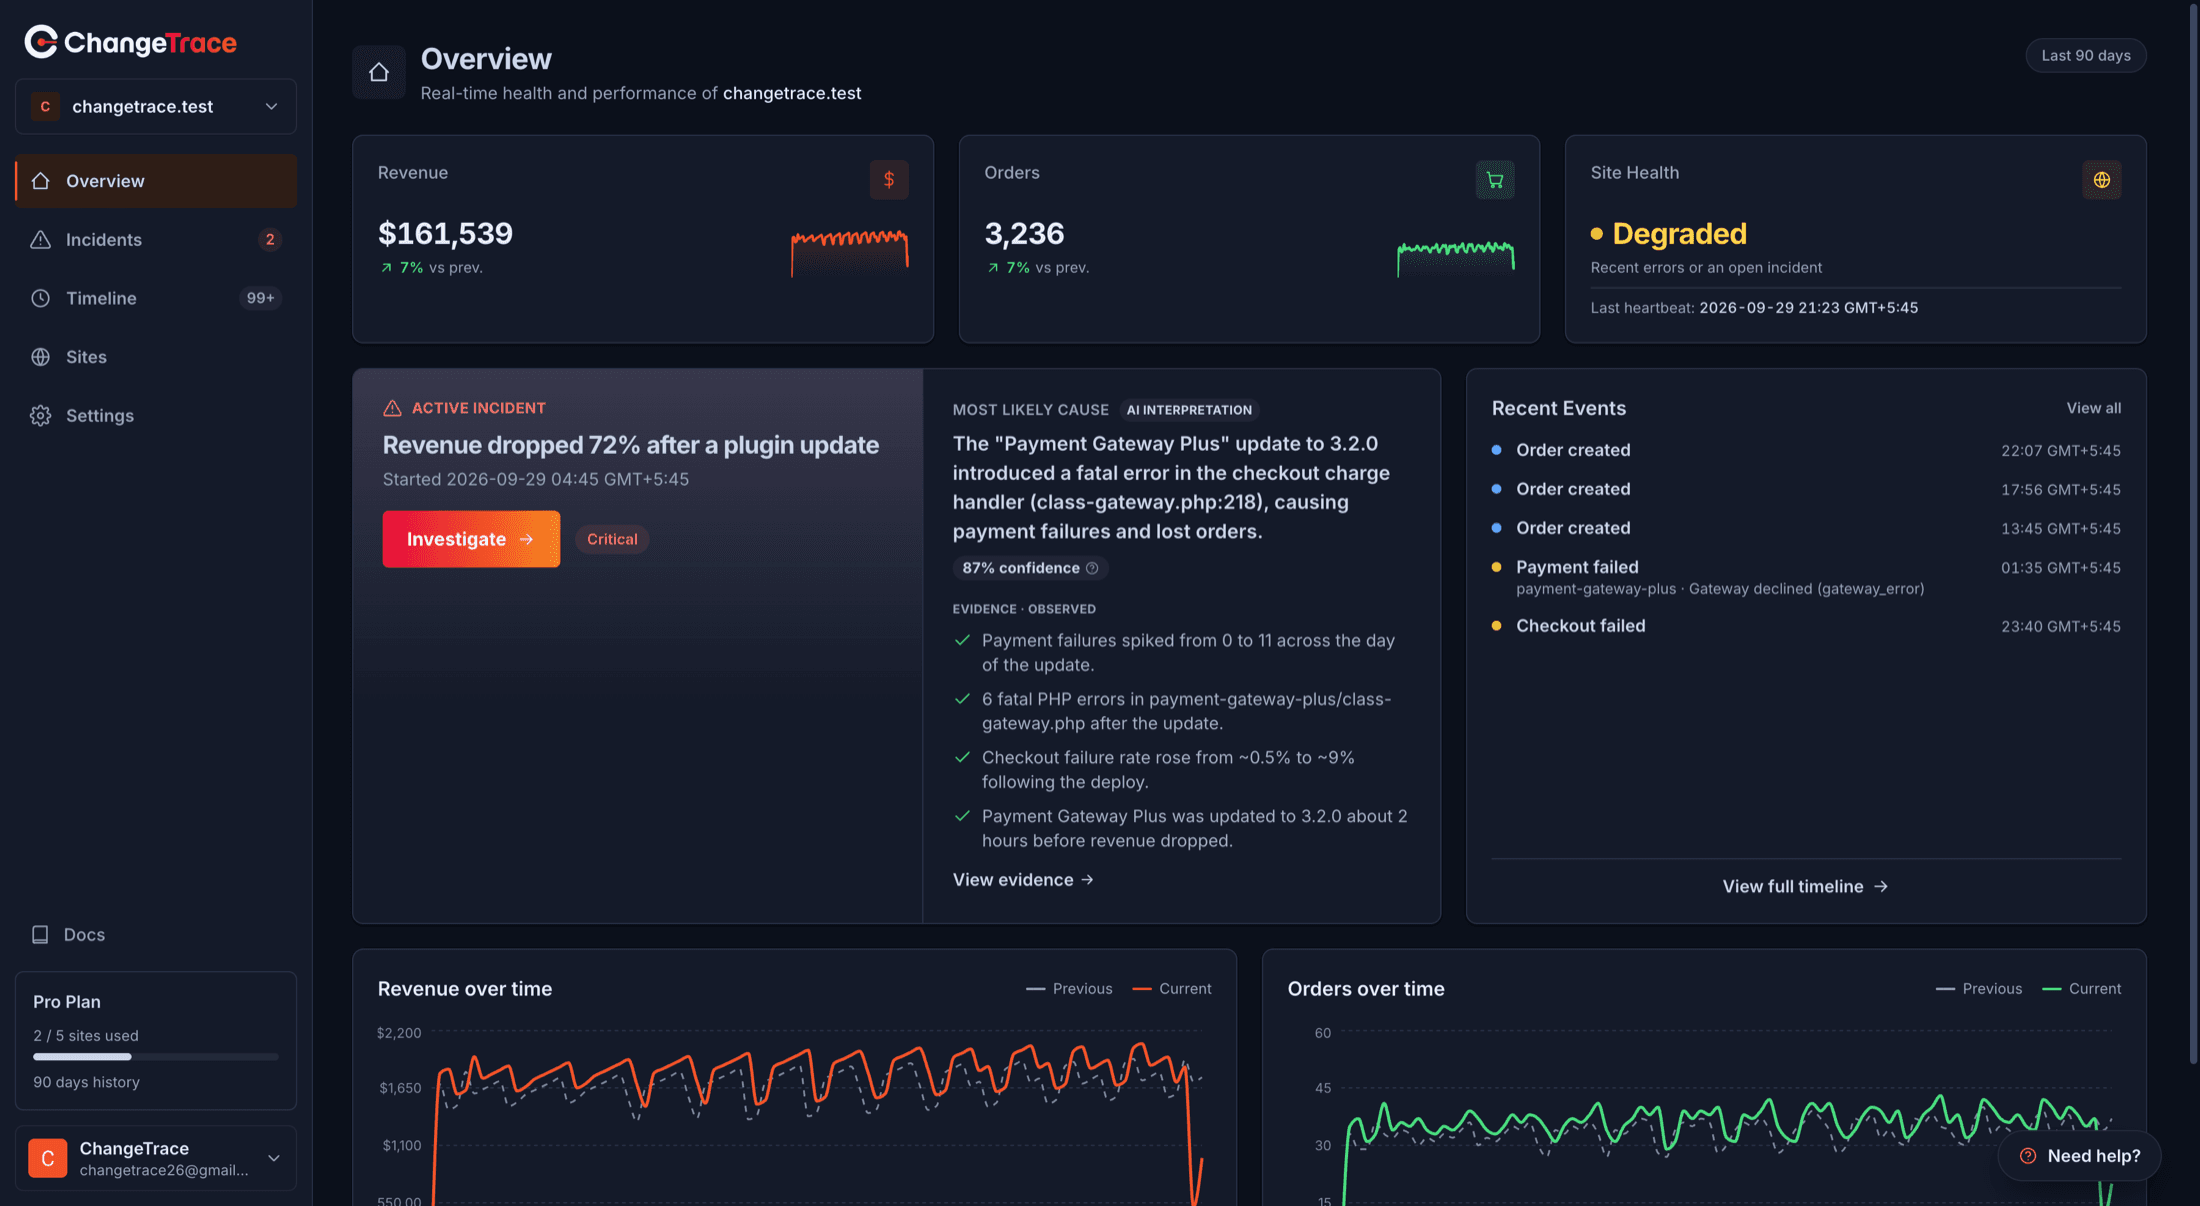
The three cards
Revenue — total for the period, in your store's own currency (taken from your commerce plugin, never assumed to be dollars), with a sparkline and the change against the previous period.
Orders — the same, as a count.
Site health — one of four states, plus the time of the last heartbeat. When your site is down it also shows the failure mode and your uptime percentage.
| State | Meaning |
|---|---|
| Healthy | Reporting normally |
| Degraded | Responds, but there is an open incident or an error cluster |
| Heartbeat Missing | No heartbeat in 2 hours — the site may be perfectly fine |
| Down | Proven unreachable from outside |
What each state actually means →
Active incident
Either the current incident — title, severity, a link through — or the all-clear:
No active incidents. Revenue and orders are tracking normally. We'll surface the likely cause here the moment something moves.
Recent events
The latest handful of changes and errors. The full list is on the Timeline.
Trend charts
Revenue over time and Orders over time, each with the previous period behind it for comparison. The comparison line is what makes a dip legible — a chart of one week on its own rarely tells you whether Tuesday was unusual.
The date range
Defaults to your plan's history window and is capped by it. On Free that is 7 days; you can select a shorter range but never a longer one, because the underlying data is deleted past that point.
If the Overview is empty
"Connect your first site" — no site is registered yet. Start here.
Cards at zero with a site connected — either no orders yet, or the plugin is not sending. Check the status table in WordPress first.
Revenue showing but health "Heartbeat Missing" — events are arriving but the hourly heartbeat is not, which usually means WP-Cron is firing unreliably.
{ }For developers
One composite request (GET /api/v1/overview?siteId=…) returns metric summaries, deltas, the
daily series, site health, the active incident and recent events. Health precedence is
down → stale → degraded → good. The selected site is persisted in a ct_site cookie and read
server-side. Currency comes from sites.currency, refreshed by the aggregator from the newest
commerce event, and only ever stores ISO-4217-shaped codes.