

Verify the connection
Read the status table in WordPress, send a test heartbeat, and know when data should appear.
Once connected, the ChangeTrace screen in WordPress becomes a status table. It is the only diagnostic surface the plugin has, so it is worth being able to read.
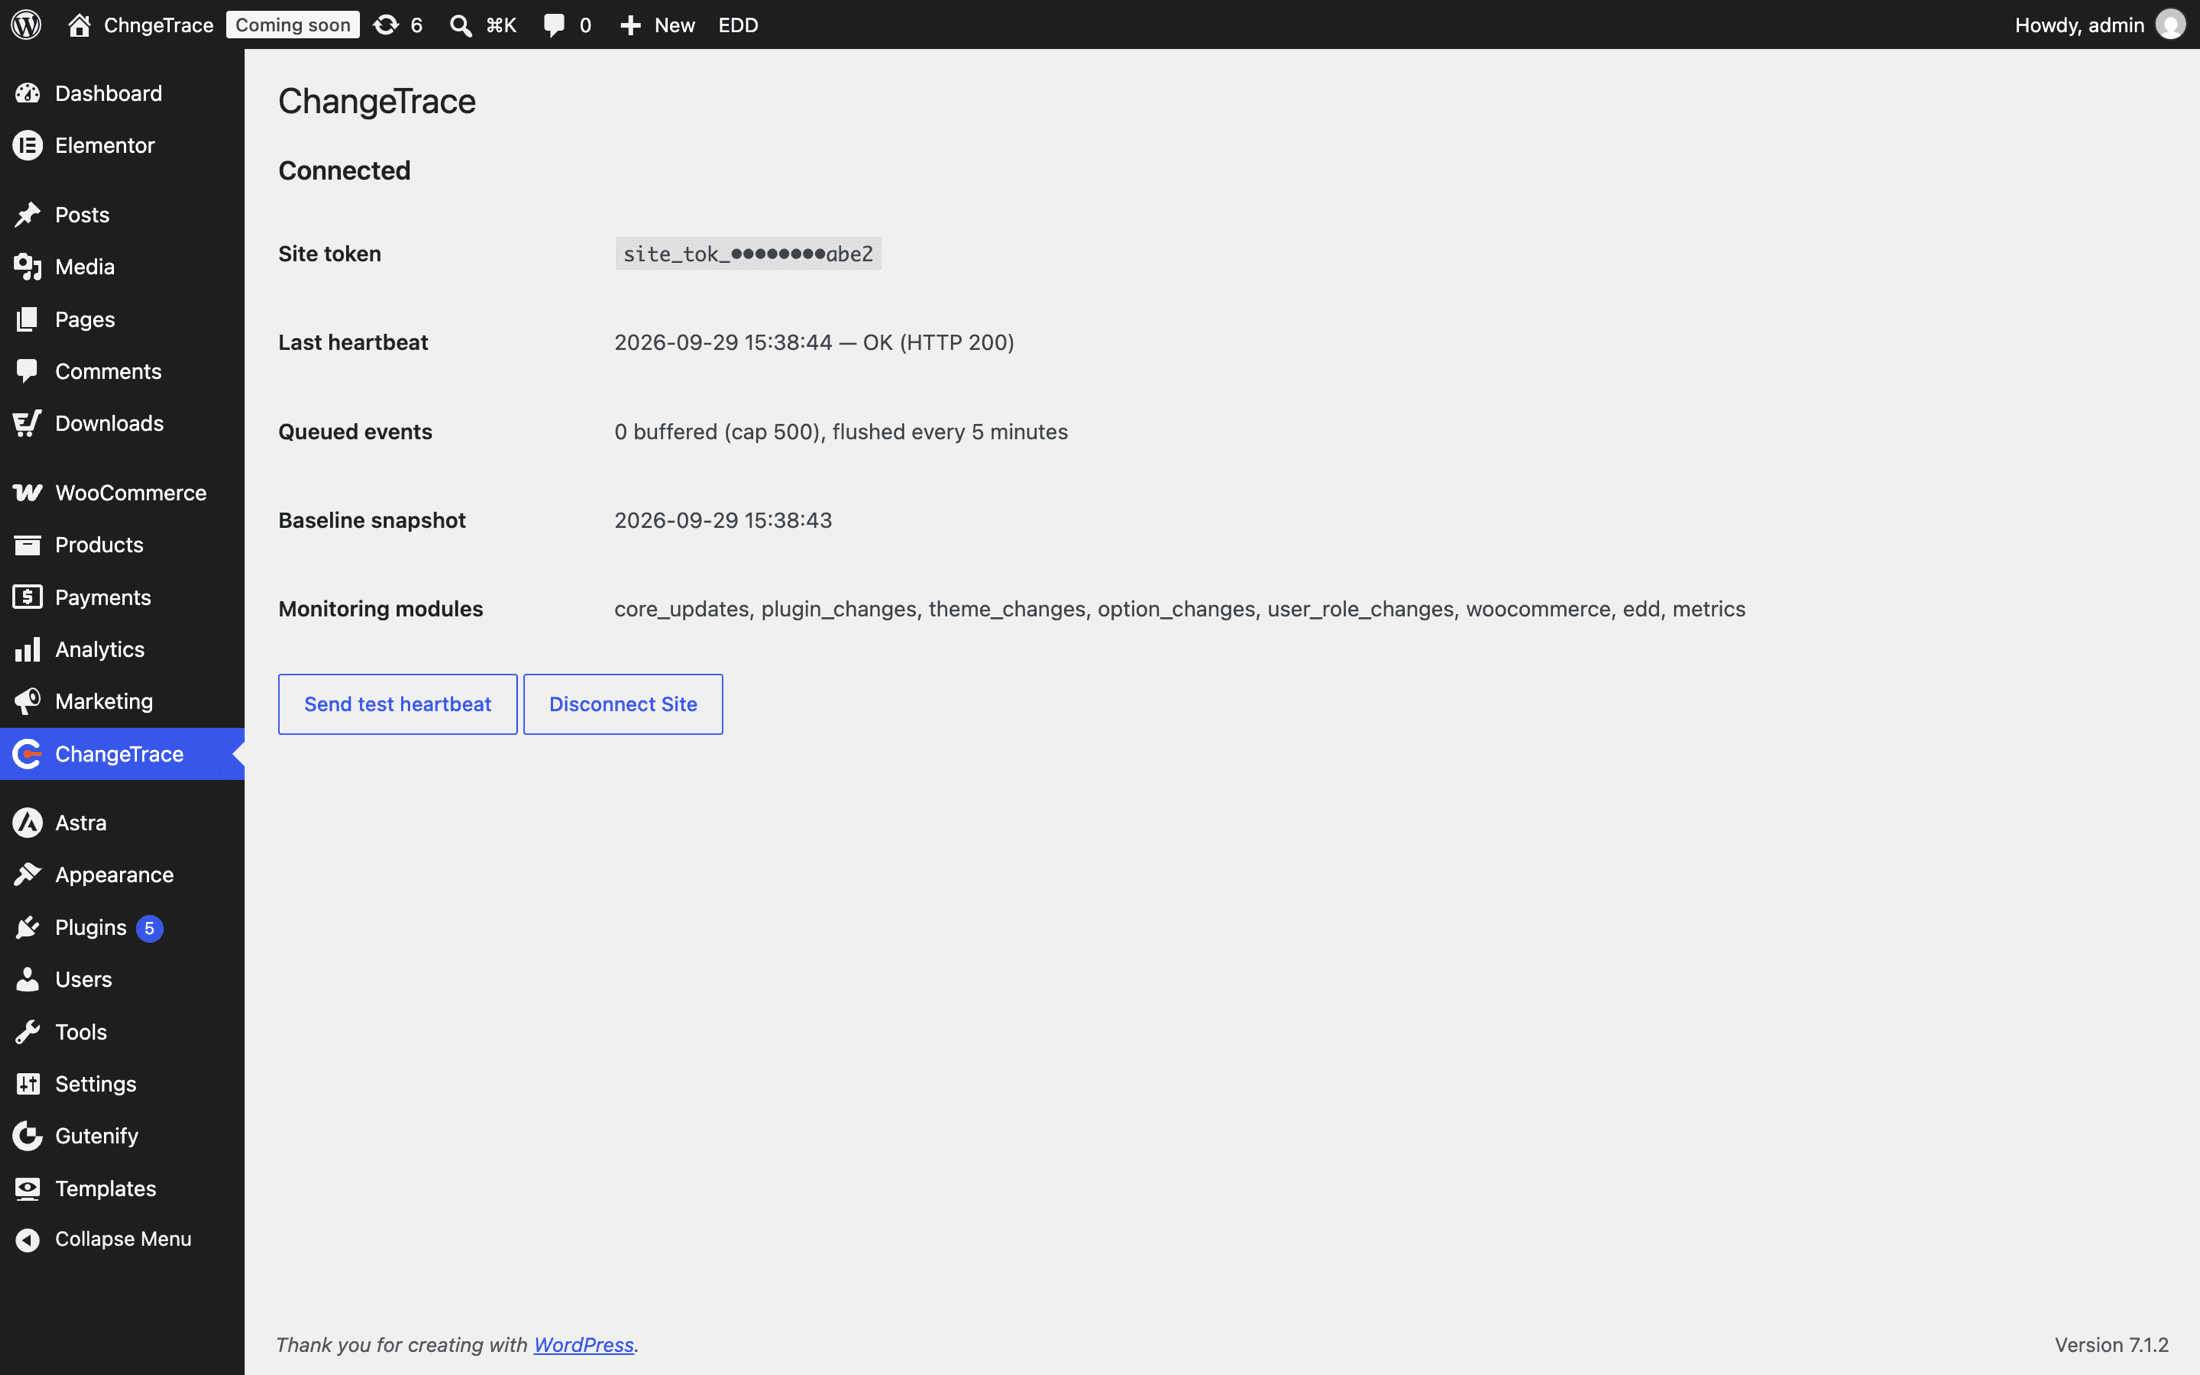
What each row means
| Row | Healthy value | What it tells you |
|---|---|---|
| Site token | site_tok_••••••••1a2b | A token is stored. Never shown in full |
| Last heartbeat | 2026-09-29 14:05:11 — OK (HTTP 200) | The last hourly check-in and its result |
| Queued events | 0 buffered (cap 500), flushed every 5 minutes | How many events are waiting to send |
| Baseline snapshot | A timestamp | Your plugins/theme/versions were recorded |
| Monitoring modules | A comma-separated list | Which collectors are switched on |
Reading "Last heartbeat"
OK (HTTP 200)— everything is working.failed (HTTP 401)— the token was rejected. Reconnect.failed (HTTP 409)— the domain does not match. See Moving or cloning a site.failed (HTTP 0)or a cURL error — your server could not reach the API.- "No heartbeat sent yet." — more than an hour after connecting, this means WP-Cron is not running. That is the most common cause of a silent install.
Reading "Queued events"
Zero, or a small number, is normal — events clear every five minutes.
A number that only grows means sends are failing. After a failure the plugin backs off, doubling the wait from one minute up to a maximum of one hour, so recovery can look slow. The queue holds 500 events; past that, the oldest are dropped to make room for the newest.
Send a test heartbeat
The Send test heartbeat button does the round trip immediately instead of waiting for the hour.
- "Heartbeat sent successfully." — your site can reach ChangeTrace and the token is valid. If data still is not appearing, WP-Cron is the suspect, since the test bypasses it.
- "Heartbeat failed. Check the API and the token." — see Troubleshooting.
Then check the dashboard
- The "Install the ChangeTrace WordPress plugin" banner disappears by itself once the first heartbeat lands. You do not need to dismiss it.
- Sites shows your domain with a status and last-heartbeat time.
- Timeline fills with changes as they happen.
When to expect what
| What | When |
|---|---|
| Banner disappears | First heartbeat, within the hour (immediately if you sent a test) |
| Changes on the Timeline | ~5 minutes after the change |
| Revenue and Orders | ~10 minutes after your first order |
| Site health "Healthy" | After the first heartbeat |
| Uptime monitoring active | Automatically, first check within 5 minutes |
| Sales-drop incidents | After ~7 days of history |
Quiet is not the same as broken
A newly connected site on a quiet day genuinely has nothing to report. Confirm the heartbeat is green and the Timeline has at least the connection event; the rest follows as things actually happen on your site.